|
Blog post by Marco Altini.
I'm about to introduce some more experimental features in HRV4Training. Before I include them in the app, I'll cover them here to better explain the rationale. More specifically, I will be including more insights and automated analysis, related to the following:
This post is about acute changes, i.e. physiological responses the day following training. Of the two aspects mentioned above (acute changes and long term training adaptations), acute changes is the easiest aspect to analyze. While many factors can impact HRV on a daily basis, it is definitely easier to analyze the impact of training on the following day's HRV, compared to long term trend analysis where even more factors might be playing a role. We will see in a future post how the trend analysis requires at least to look at a couple of parameters at the same time, while for day to day changes we can focus on rMSSD only. Data
I used data collected over a bit less than 8 weeks of trainings between January and March 2014. Here is what I have:
I selected this period because I was training relatively well for my standards. No other major stressors, no injuries, no traveling, and a good amount of trainings. Let's start by looking at HRV (rMSSD) and HR daily fluctuations. Clearly there is a lot of jumping around the baseline (gray line). This jumping are the acute changes we are interested in quantifying with respect to training: 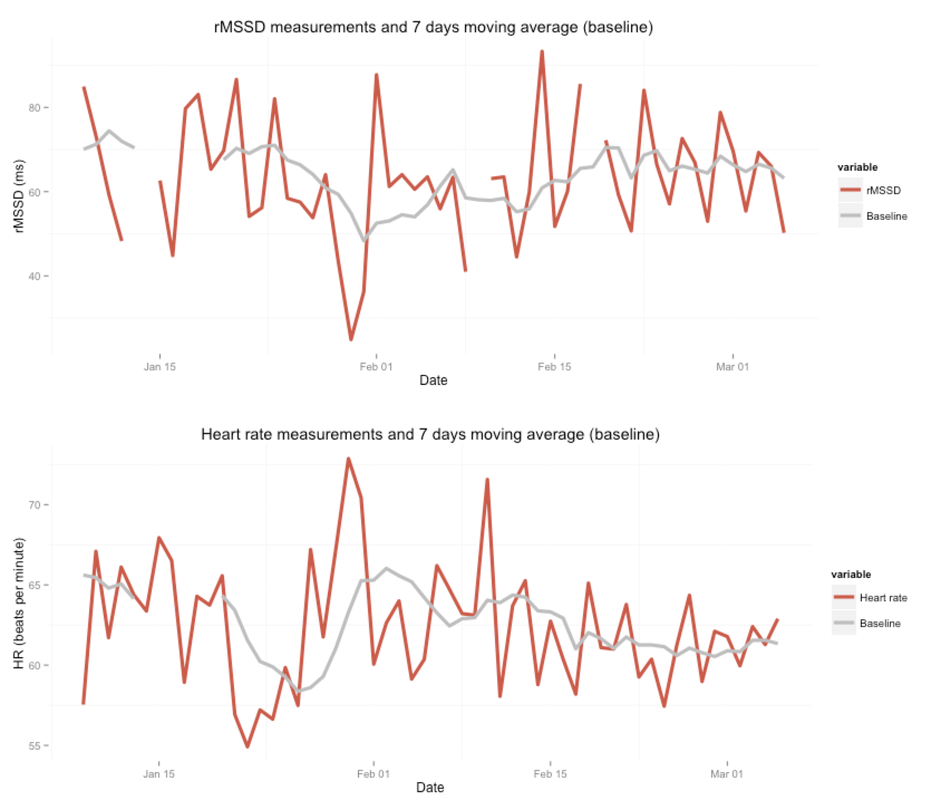
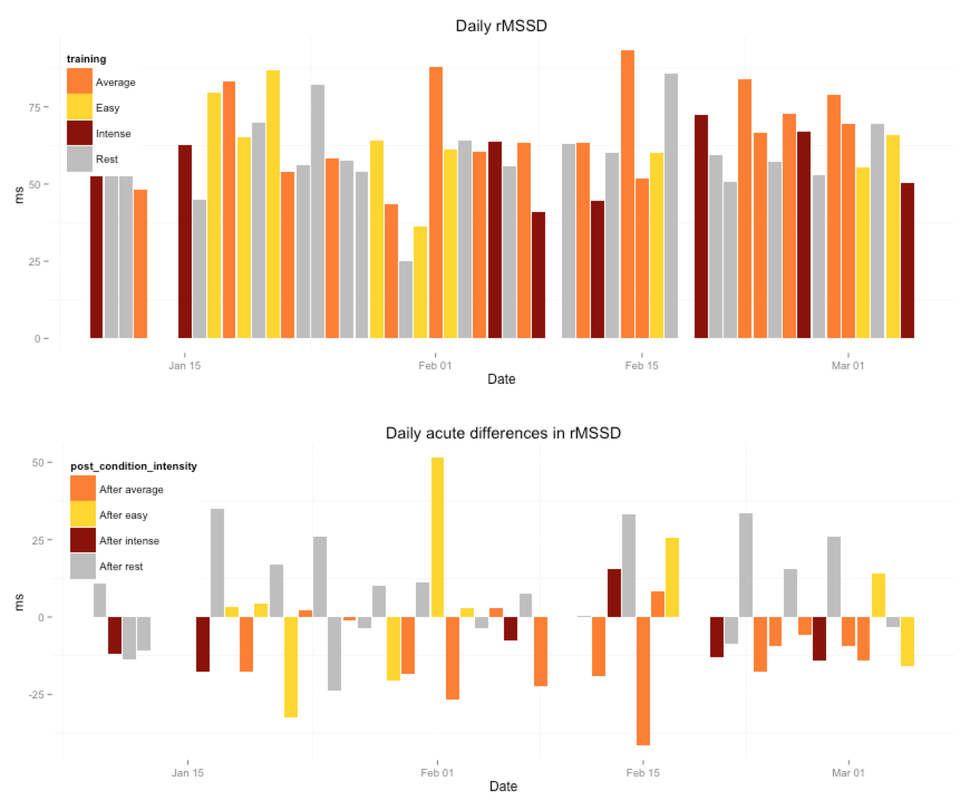
Below is my training intensity data. The colors are the manual annotations in the HRV4Training app. In the top plot we can see the rMSSD value each day and how I trained in terms of intensity. The bottom plot is the more interesting one. I shifted the labels, therefore they don't represent anymore how I trained that day, but how I trained the day before. This way we can see quickly the effect of training on HRV. For example, looking at the red bars in the bottom plot we see that my HRV had a drop after intense trainings 5 times out of 6 annotated intense trainings. Average trainings, highlighted in orange, also are predominantly showing negative differences, i.e. a drop in HRV.
Let's analyze this data more systematically.
How does training affect your physiology?
As explained above, for this analysis I looked at the change in HR and rMSSD the day after training (daily acute differences shown above). As "training condition" I included training at average and intense intensities, since easy trainings or recovery runs can have the opposite effect on HRV (i.e. HRV increase after easy training due to a stimulatory effect on parasympathetic activity).
Here is what I have: 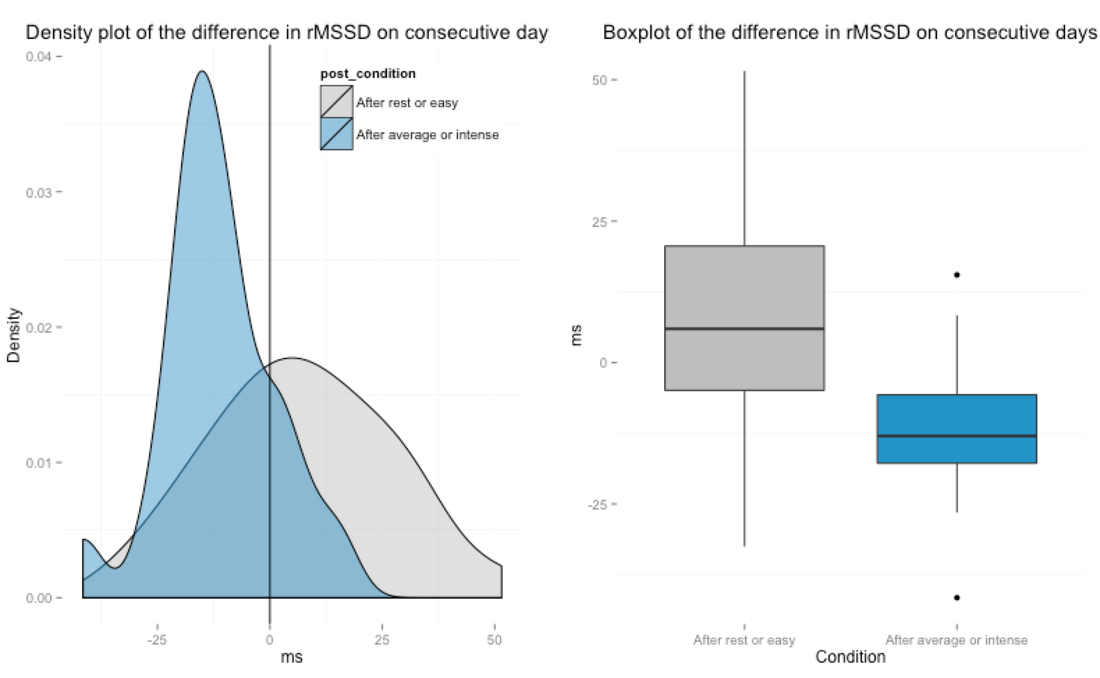
We can see there is some overlap in the plot above. This is expected, there is always a lot of variability in HRV values. After a no-trianing day, values are a bit all over the place. There might be many different factors behind the fact that I didn't train, for example taking an intercontinental flight won't make my rMSSD better even if I did not train. Context is always key.
However, we can see over the 8 weeks period a consistent shift of the distribution for days after average or intense trainings. The blue distribution is peaking on the left side of the zero line, meaning that rMSSD is consistently reduced after average or intense trainings. The same is shown on the right with the boxplot. We can also see that rest days peak on the right side of the zero line, and the median (shown in the boxplot) is well above zero, meaning that normally after rest or easy trainings rMSSD is increased with respect to the day before. Here are some numbers:
As usual it's interesting to look at this situation in parallel for both rMSSD and heart rate. Plotting the same measurements and conditions, but for heart rate data, we can see there is almost perfect overlap and we cannot really distinguish between training or no-training days: 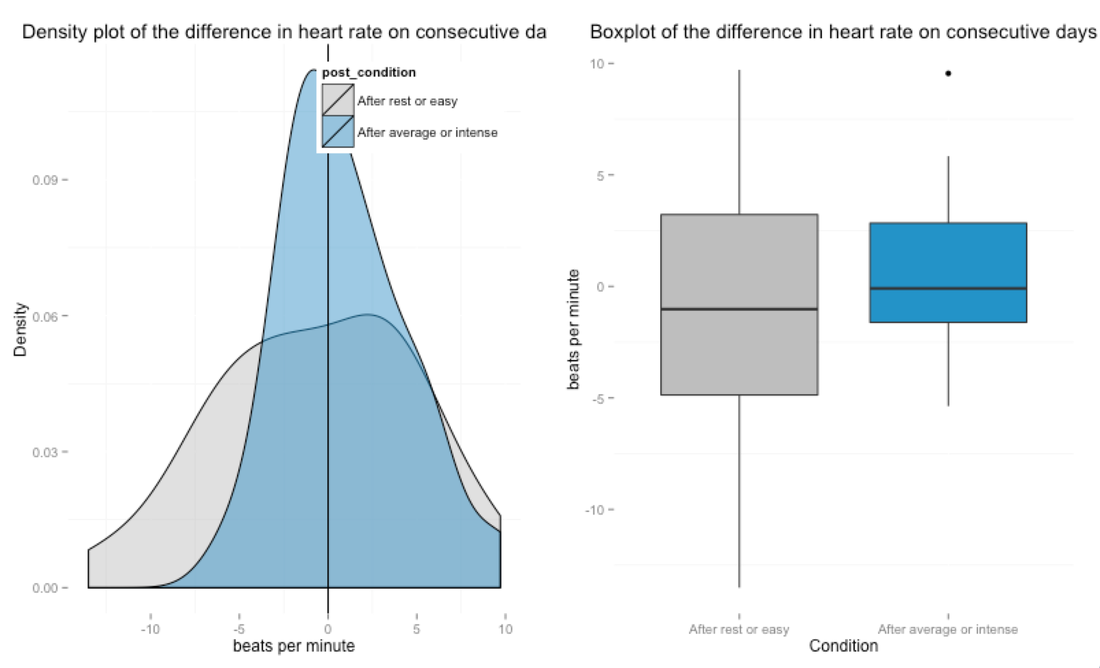
This means that for day-to-day acute changes used to adjust training plans based on daily physical condition, we should be using rMSSD and not heart rate. Heart rate can still be valuable over the long run.
How do trainings of different intensity affect your physiology?
Now let's look in more detail at training intensity, as manually annotated in the app.
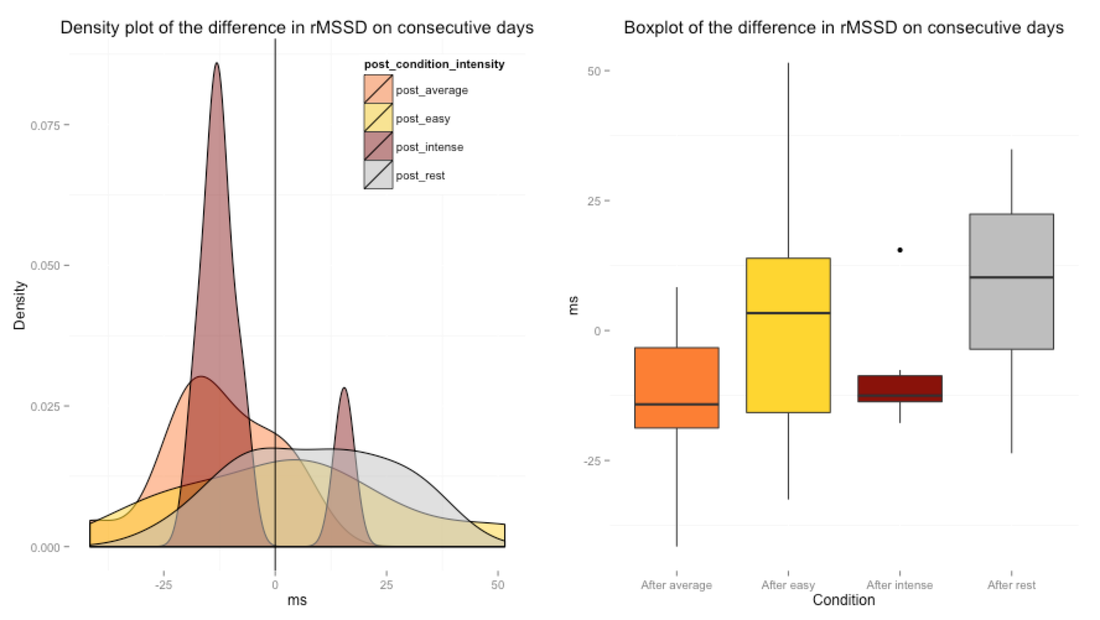
We can see I clearly have an outlier among the post-intense days (red peak on the right side of the zero line). Apart from this point, intense and average trainings show clear reductions in rMSSD, i.e. acute drops following average or intense trainings. Rest and easy trainings are a bit all over the place, but on average show an increase in rMSSD.
Some numbers:
Given that heart rate acute changes were not discriminative of the two conditions above, I will not investigate them further here. Summary and new features
By looking at acute changes beyond differences from the baseline and daily advice, but longitudinally over weeks or months, we can get some better understanding of how we cope with training.
For example, from my data shown above, I can hypothesize at least the following:
To allow every user to look at acute changes over longer periods of time, and better understand how training impacts physiology, I'm adding some new features to HRV4Training. Basically, a slightly simplified version of what I've just covered here. The colors are the same used in this post, for clarity. Here are some screenshots, starting with the analysis of rest and easy trainings vs average and intense ones: 
and finally the analysis breakdown by training intensity: 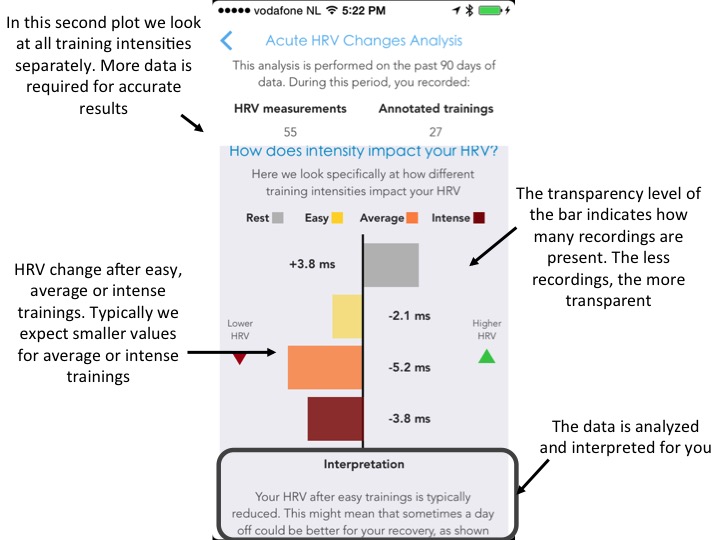
The data is my last 90 days of data as of September 6th. We can see from the top screenshot that HRV is reduced after training days, since the blue bar is on the left side. Rest days normally increase my rMSSD by about 4.5 ms. As the app says, this might mean that training load reflects on my daily recordings, and I can adjust my trainings based on these HRV measurements.
The second screenshot shows a breakdown by training intensity. I don't have that many trainings for this period, and I was in quite a poor shape recently. This might explain the reduction in rMSSD even after easy trainings, something we didn't see in the analysis above where we looked at 2 months of good physical condition. As usual, training intensity is not the only factor affecting HRV and more parameters should be taken into account. This is a starting point on which I will later on build up including more manually annotated parameters. The current analysis includes automated messaging for the cases which are easier to understand and more or less expected. For other situations, here is a list that might give some extra explanations if you see unexpected results while analyzing long term acute HRV changes.
3 Comments
Lukas
11/6/2015 03:44:00 am
Hi Marco,
Marco Altini
11/6/2015 07:35:00 am
Good point Lukas. It's on my agenda to provide a bit of a better understanding around the day to day differences, and allow you to see if the differences are trivial or not (similarly to what is already part of the Trends analysis). Will come soon!
Ambrose Soehn
5/26/2016 02:26:29 pm
Hi Marco, Your comment will be posted after it is approved.
Leave a Reply. |


Register to the mailing list
and try the HRV4Training app! 
|