|
Blog post by Marco Altini In this post, I provide a short overview of HRV features. When getting started with HRV, things can get overwhelming and confusing pretty quick. One of the main reasons is probably the many different ways HRV can be computed from RR intervals, or what we call HRV features. While we have dedicated many words (and many examples) in this blog to our favorite HRV feature (rMSSD), it can be helpful to provide a short overview of the most frequently used features, so that we can better understand why rMSSD is a good choice, and what are the limitations of other methods. Keep in mind that the motivations are both physiological (what is happening in the body in terms of heart rhythm changes in response to stress) and mathematical (how the physiological processes can be captured by processing the RR intervals differently). Physiologically speaking, and making a few oversimplifications, the autonomic nervous system regulates heart rhythm, and therefore we can monitor changes in heart rhythm (HRV) as a way to measure how we react to stressors (training, lifestyle, etc.). In the context of monitoring the effect of different stressors on our physiology, both in the short term and chronically, we are interested in quantifying parasympathetic activity. The parasympathetic branch of the autonomic nervous system is the one in charge of rest functions and recovery, and therefore we are interested in monitoring it because reduced parasympathetic activity is a clear sign of increased stress and poor recovery. For a deep primer on the physiology of resting HR and HRV, check out this blog. For now, remember that this will have implications in terms of the math used to compute HRV, as I'll show later on. The main features of interest can be split into time and frequency domain features, a distinction that has to do with how the RR intervals are mathematically processed. The most common time domain features are the following:
Let's get started.  Time domain featuresMathematically speaking, time domain features are simpler to compute and rather standard, hence one of the advantages is that we can be quite sure that what we are comparing (between apps, papers, etc.) is the same thing (we'll see this is not the case for frequency domain features). That's a good start, but what we really care about, is the ability of these features to capture underlying physiological processes such as the autonomic nervous system response to stress. In this context, rMSSD is by far the best candidate. Let's learn more about the other features first, which will help us understand why. AVNNAVNN is simply the average of the RR intervals. Thus, this has little to do with beat to beat variability and is simply the inverse of heart rate. It is still worth mentioning it as many believe in a linear relationship between heart rate and HRV (for example that HRV always decreases when heart rate increases) but this is not the case. It is common to have the same AVNN (or the same average heart rate) for different HRV values as the beat to beat variability can reduce or increase in response to stress, regardless of changes in average heart rate (or with very small changes in average heart rate). Again, this feature is simply the inverse of heart rate, and as such, it is completely redundant if we already look at average heart rate. SDNNSDNN refers to the standard deviation of the RR intervals. This feature has a long history and was used mostly in the context of 24 hours measurements in medical practice. The idea is that by looking at SDNN we could get an understanding of cardiac variability changes throughout the day, as a response to circadian rhythm and acute stressors. It was mainly about distinguishing no variability at all (the inability of the system to react to any stressor, as it can happen in case of severe chronic conditions / disease) vs a healthy cardiovascular system — as SDNN mathematically computes the amount of variability in our 24 hours of RR intervals (beat to beat differences). This method allows to quantify macro-differences in physiology between specific medical conditions and healthy controls (between-individual studies). This method is also highly dependent on physical activity and other confounding factors that affect physiology during the day. Personally, I would speculate that most differences between groups detectable by SDNN over 24 hours are also captured by morning or night measurements (well contextualized resting physiology) in terms of clear markers of parasympathetic activity such as rMSSD or HF. When the Apple Watch started reporting SDNN a few years back, I looked at it a bit more in detail, and wrote this blog showing that this feature is also able to capture variability in a similar manner to rMSSD. Yet, if we can choose, I would not use SDNN over rMSSD, and this comes down to math. While most of these metrics tend to capture variability, SDNN is not ideal as it captures mathematically deviations from the mean, not high frequency beat to beat changes due to vagal activity (see next points). pNN50pNN50 is computed as the proportion of consecutive RR intervals that differ by more than 50ms. This is intuitively the most problematic feature as it introduces a rather arbitrary threshold (50 ms) which is most likely linked to an older way of thinking (thresholding on physiological values to distinguish groups of people). Clearly, the higher the variability, the higher pNN50, but still, why would we threshold on 50ms? There are indeed many variants of this feature, also thresholding on 20 ms (pNN20), etc. I have not seen much use of pNN50 in the last few years, this seems to be the least used feature these days, which makes sense to me given the considerations brought up in this post. rMSSDrMSSD is computed as the root mean square of successive differences between RR intervals. When computing rMSSD, we look at beat to beat differences, thus the rMSSD feature is associated with short term changes in heart rhythm. Since parasympathetic activity works at a faster rate (e.g. < 1 second) compared to sympathetic activity, rMSSD is considered a solid measure of vagal tone and parasympathetic activity, similarly to the high frequency power (HF, discussed later). Hence, among the time domain features, rMSSD is the only one where mathematically we capture the physiological process we are interested in. There are several other advantages in using rMSSD. Being easy to compute, values can be compared across studies. Something which is almost impossible when looking at frequency domain features (see later). Also, rMSSD is time invariant, so using a shorter or longer time window still provides comparable results. Finally, multiple studies validated the reliability of rMSSD for measurements as short as 60 seconds (or even shorter), therefore making it a very practical alternative for consumer products. Over the years, we have shown many examples of changes in rMSSD in response to various stressors. For an overview, check out this blog post. Note that in all our blogs you will see scores in the 6-10 range, this is what we call HRV in HRV4Training and is simply a logarithmic transformation of rMSSD.  Frequency domain featuresFrequency domain features are among the most popular (and probably the most misunderstood) features. It is still common to read papers talking about autonomic balance, the LF to HF ratio, etc. - despite the mounting evidence that these are not aspects that can be measured. What can be measured is parasympathetic (or vagal) activity, which is associated with high frequency changes in heart rhythm, as introduced above in the context of rMSSD. But let's cover in more detail LF and HF. LFLF refers to a frequency band between 0.04 and 0.15 Hz as derived when computing the frequency power spectrum of the RR intervals collected over at least 2 minutes. In the old days, LF was thought to be associated to sympathetic activity, but this view has changed over the years, and it seems now clear that LF includes a bit of everything, and as such, is of little use outside of very specific applications (more on this later). HFHF refers to a frequency band between 0.15 and 0.40 Hz as derived when computing the frequency power spectrum of the RR intervals collected over at least 1 minute (higher frequencies can be computed with less data). While we finally moved away from LF as a marker of sympathetic activity, HF is still considered a good marker of parasympathetic activity. This is correct as vagal activity happens quickly (a matter of milliseconds), and therefore can be captured by high frequency changes in heart rhythm. rMSSD and HF are indeed highly correlated, as they capture the same mechanisms. Why do we prefer rMSSD then? It comes down to math again. One reason is simply linked to poor standardization, as there are various choices to be made from a mathematical point of view on interpolation, windowing, FFT, etc., and therefore it becomes often impossible to compare studies. The second issue is that once again we rely on some threshold (the frequency band) which can fail under certain circumstances due to the tight link between HRV and breathing. Consider the following: say you are doing a deep breathing exercise to strengthen the parasympathetic system (biofeedback / meditation, etc.). In this case you are "as parasympathetic as you can be" and yet your deep breathing will move the dominant frequency to the LF frequency band (if you breathe around 6 breaths per minute for example, as recommended for these practices), and therefore your LF will increase, HF decrease, and none of these metrics will make sense. On the contrary, rMSSD will reflect the increase in parasympathetic activity. Below you can see an example of a biofeedback session showing the mechanism I have just explained. We have 2 minutes at rest, followed by 10 minutes of deep breathing and another 2 minutes at rest. When deep breathing, there is a clear increase in LF as the breathing frequency that is typically in the HF band, moves to the LF band. We can also see how the exercise does not affect LF at all as soon as regular breathing is resumed, as highlighted by the lower LF the last two minutes. In the two bottom plots we can see HF and rMSSD, two features representative of parasympathetic activity. I have plotted both to show how HF is highly dependent on breathing frequency, and despite the great oscillations in RR intervals, the fact that we are breathing in a band outside HF results in quite inconsistent results, sometimes with values below resting values. 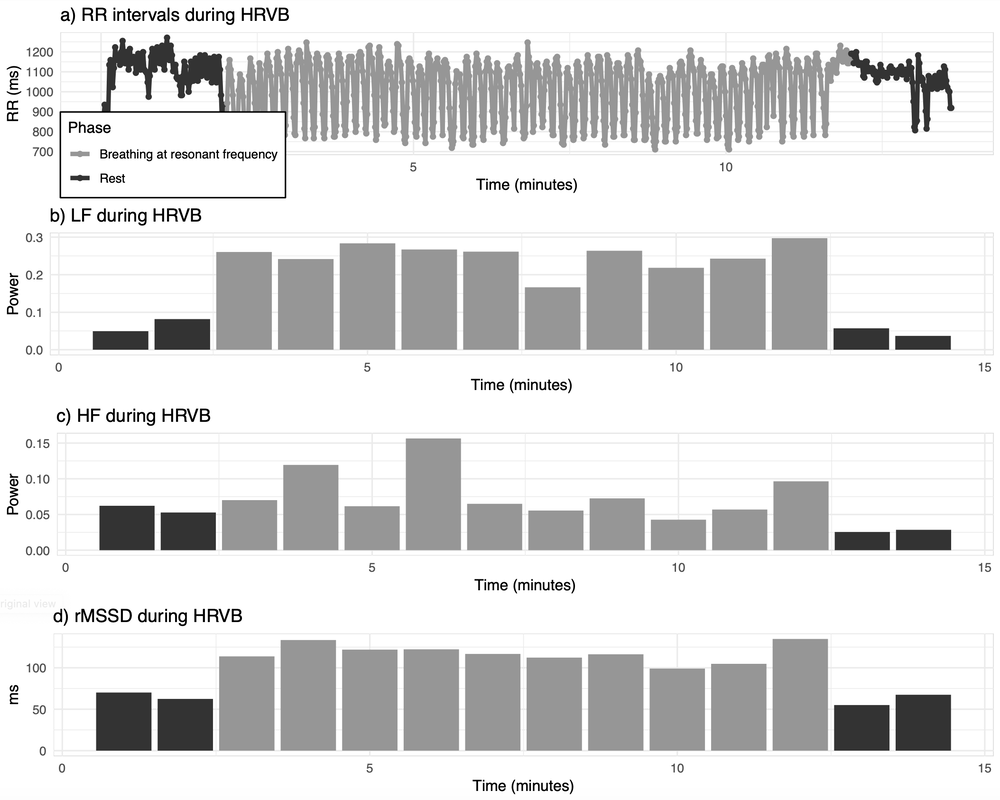 TakeawaysIn my view, rMSSD is the most important metric to look at, in terms of HRV features for short morning measurements taken at rest (or during the night), when our goal is to quantify baseline physiological stress in response to acute and chronic stressors (both training and lifestyle related), which is reflected very well in parasympathetic activity. Most other features will tend to be highly correlated (it's still HRV), but less representative of what we are interested in measuring (parasympathetic activity). In HRV4Training, HRV is simply a transformation of rMSSD to make the data easier to read. If our goal is to look at things like deep breathing, then by all means LF is the best candidate, but this is a different application (make sure in this case to use at least 2 minutes of data, as otherwise LF cannot be computed correctly). The way I use the data is normally the following:
I hope this article was helpful in getting some clarity around the most common HRV features. Useful linksWe recently put together a series of posts that cover many aspects of HRV measurement, data interpretation as well as plenty of examples that you can look at to better understand how to make use of the data, and how HRV relates to training and lifestyle stressors.
Check them out at these links:
Finally, in our latest article What you need to know about Heart Rate Variability (HRV) data collected during the night we discuss important aspects associated to collecting HRV data during the night. Comments are closed.
|


Register to the mailing list
and try the HRV4Training app! 
|